Operator UI
Discover how to interact with the Operator UI in OpenHTF, featuring real-time test streaming, test progress, and control options.
Last updated · Verified with OpenHTF 1.6.1
Start and monitor your Runs in real time from the production floor.
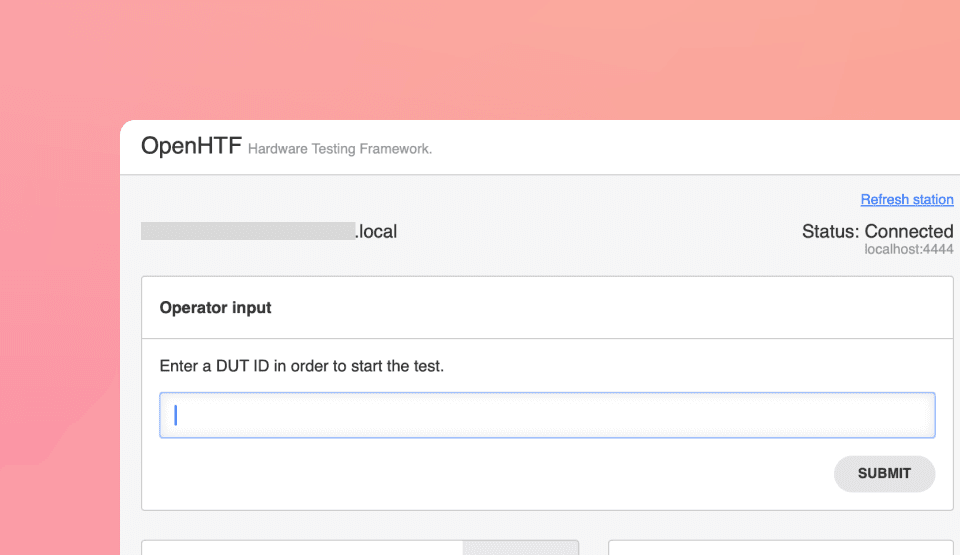
The Operator UI provides a streamlined web interface for running and tracking test procedures deployed to production stations. It's designed for operators on the shop floor to easily start tests, respond to prompts, and monitor test execution in real time.
Syntax
The Operator UI is powered by the station_server, which serves the web interface, and web_launcher, which opens it in the browser. Operator interactions—like entering serial numbers or confirming visual results—are handled through the user_input plug.
station_server.StationServer(history_path=None)context managerStarts the HTTP server that hosts the Operator UI. The port comes from the station_server_port configuration key (default 0 = random free port); history_path points at a directory of past JSON records to show in the history panel.
server.publish_final_stateoutput callbackAdd with test.add_output_callbacks(...) so the finished record appears in the UI's history.
web_launcher.launch(url)str → voidOpens the Operator UI in the default web browser at the given URL.
test.execute(test_start=user_input.prompt_for_test_start())callableStarts the test only after an operator initiates it via the UI prompt.
Usage
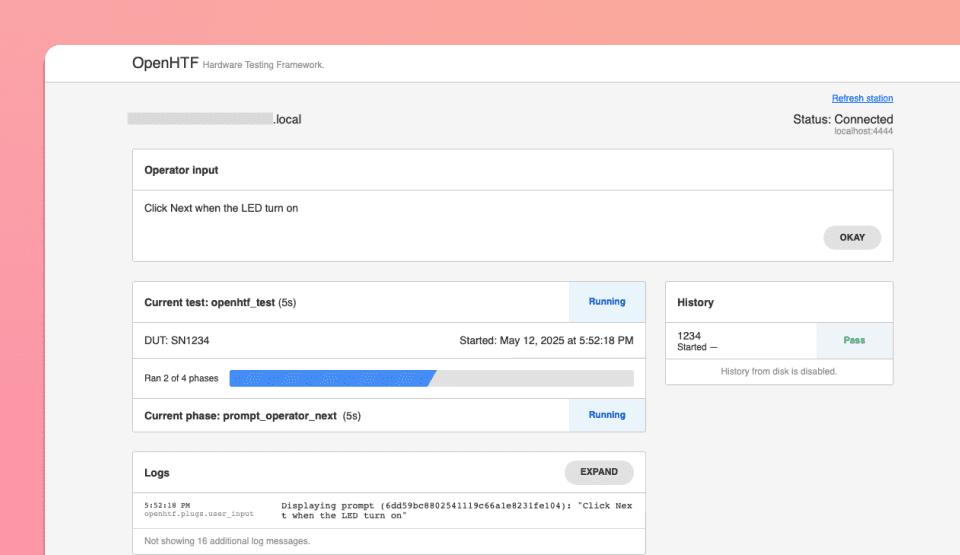
This example demonstrates a basic OpenHTF test that launches the Operator UI and prompts the user to enter a serial number before starting the test. It includes three phases: one automatic and two requiring operator input. Of the two operator input phases, one prompts the operator to enter information, while the other simply waits for the operator to click the "Okay" button.
Once the script is running, you can access the Operator UI at http://localhost:4444.
import openhtf as htf
from openhtf.output.servers import station_server
from openhtf.output.web_gui import web_launcher
from openhtf.plugs import user_input
from openhtf.util import configuration
from openhtf.plugs.user_input import UserInput

CONF = configuration.CONF


@htf.measures(htf.Measurement("hello_world_measurement"))
def hello_world(test):
    test.logger.info("Hello World!")
    test.measurements.hello_world_measurement = "Hello Again!"


@htf.plug(user_input=UserInput)
def prompt_operator_next(test, user_input):
  is_connected = user_input.prompt(
      message="Click Okay when the LED turn on",
      text_input=False, # Button prompt from operator
  )


@htf.measures(
    htf.Measurement("led_color").with_validator(
        lambda color: color in ["Red", "Green", "Blue"]
    )
)
@htf.plug(user_input=UserInput)
def prompt_operator_led_color(test, user_input):
    led_color = user_input.prompt(
        message="What is the LED color? (Red/Green/Blue)",
        text_input=True,  # Text prompt from operator
    )
    test.measurements.led_color = led_color


def main():
    CONF.load(station_server_port="4444")
    with station_server.StationServer() as server:
        web_launcher.launch("http://localhost:4444")
        test = htf.Test(
            hello_world,
            prompt_operator_next,
            prompt_operator_led_color)
        test.add_output_callbacks(server.publish_final_state)
        test.execute(test_start=user_input.prompt_for_test_start())


if __name__ == "__main__":
    main()
Interface walkthrough
Test Start
Begin your test with an operator input, such as entering a serial number.
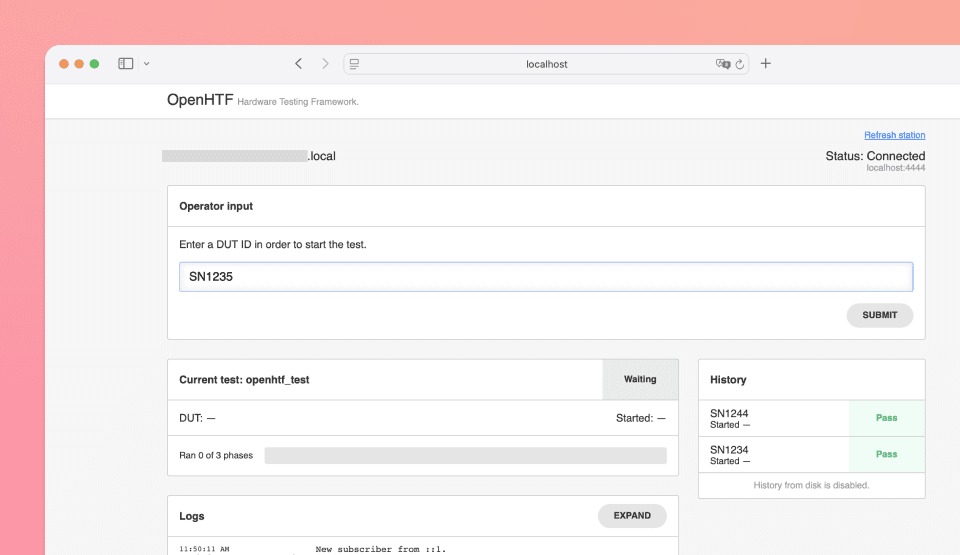
Operator prompt
Use user_input.prompt() to ask the operator for manual input, such as confirming an LED color, or clicking on Okay button. These two options depend on the boolean text_input value (defaults to False when not specified).
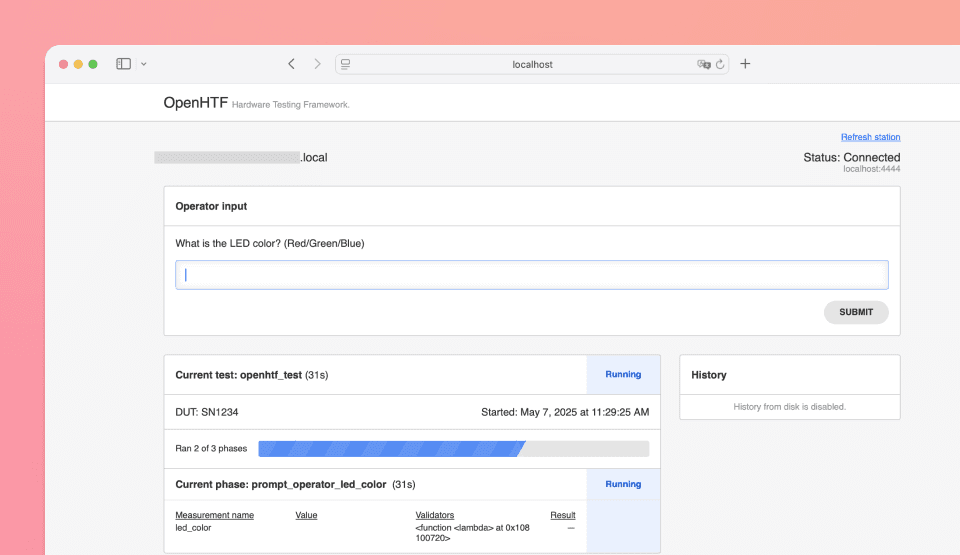
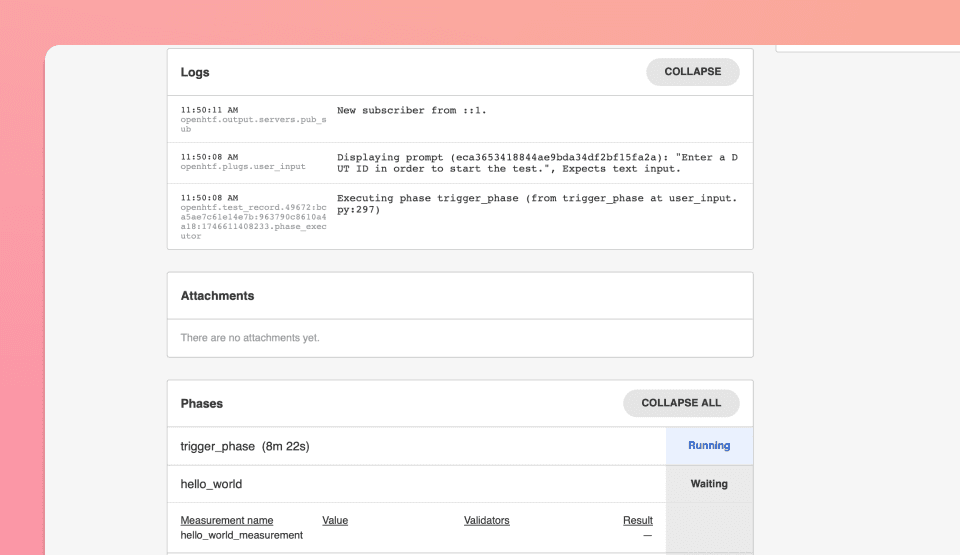
Test phases and results
At the bottom of the UI, you'll see:
- A timeline of executed test phases
- Recorded measurements
- Attachments
- Logs
Click Expand to view detailed phase data.
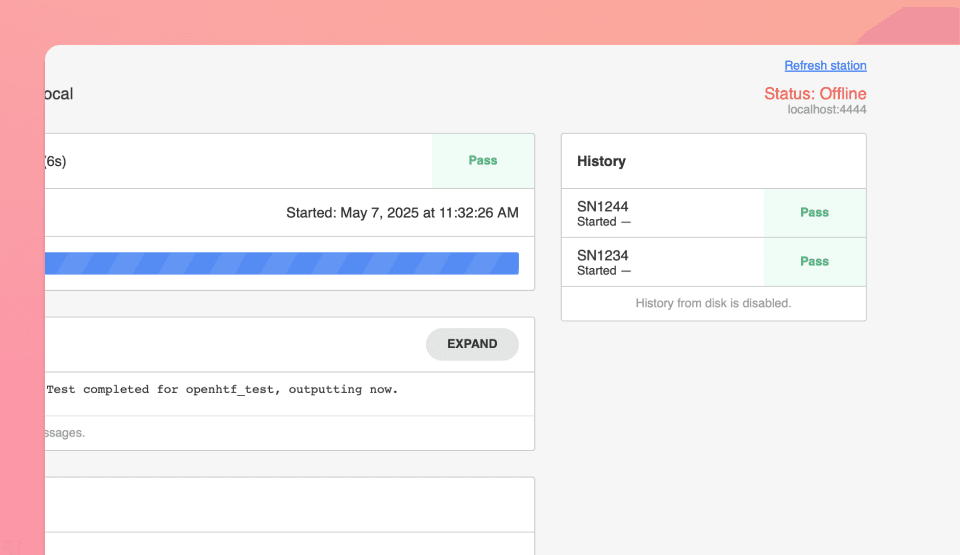
Station panel
On the right-hand side, you'll find:
- A Refresh Station button
- Live online status
- Test history (e.g., previous serial numbers)
Limits
The bundled UI serves one test on localhost, keeps history only for the current process, and has no authentication. To open it to the network, run several stations, or keep history, see Multi-station dashboard for the built-in dashboard_server, or TofuPilot's Operator UI for a hosted one with authentication and searchable history.
Need the UI on more than one machine?
TofuPilot serves the same prompts and live phases over HTTPS to any browser on the network, with user accounts and run history, without changing your test code: tofupilot run . — see TofuPilot's Operator UI.
